How we impact
act PROSPERI.AI
Act Digital Corporate Artificial Intelligence
Solutions
Services
Partners
Google Lighthouse is an open-source automated tool developed by Google that helps evaluate and improve website’s performance, accessibility, best practices, and Search Engine Optimization (SEO). It provides developers, designers, and website owners with valuable insights and recommendations to enhance the overall quality and user experience of a website.
Lighthouse performs audits on web pages by simulating the loading and rendering process in a controlled environment. It measures various performance metrics, including page load speed, network efficiency, rendering performance, and interactivity. It also checks for accessibility issues, such as proper HTML structure, alt text for images, and keyboard navigation support. Additionally, Lighthouse examines the implementation of best practices, such as using secure connections (HTTPS), optimising images and code, and ensuring responsive design.
After conducting the audits, Lighthouse generates a comprehensive report with a performance score and detailed recommendations for improvement. The report highlights areas where the website excels and areas that require attention or optimisation. It provides specific suggestions, code snippets, and resources to address identified issues and enhance the website's overall performance and user experience.
Google Lighthouse is widely used by developers, designers, and website owners as a valuable tool for identifying and resolving performance bottlenecks, accessibility barriers, and SEO deficiencies. By following Lighthouse's recommendations, website owners can deliver faster, more accessible, and search engine-friendly websites that provide an exceptional user experience.
The Lighthouse report is a comprehensive assessment that provides detailed insights into the performance, accessibility, best practices, and SEO aspects of a website. The report consists of various metrics and recommendations to help improve the website's overall quality and user experience.
Here are some key metrics commonly included in a Lighthouse report.
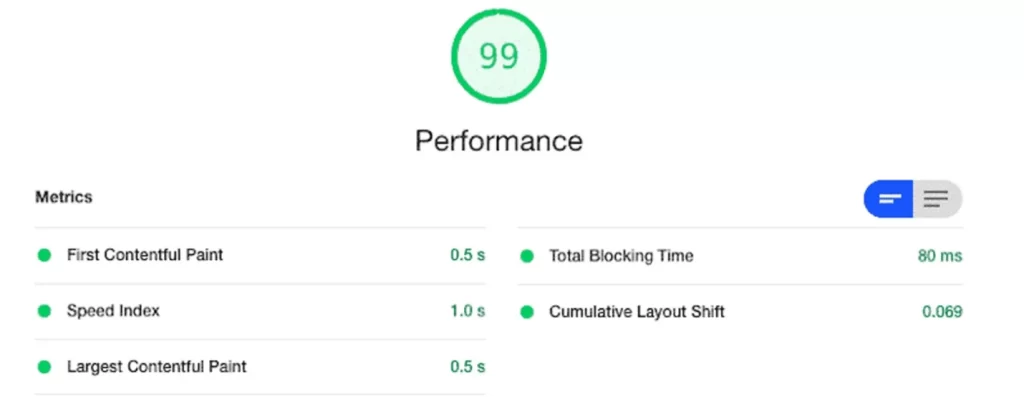
Lighthouse measures performance-related metrics, which evaluate the loading speed and responsiveness of the website, helping identify areas for optimisation.
First Contentful Paint (FCP)
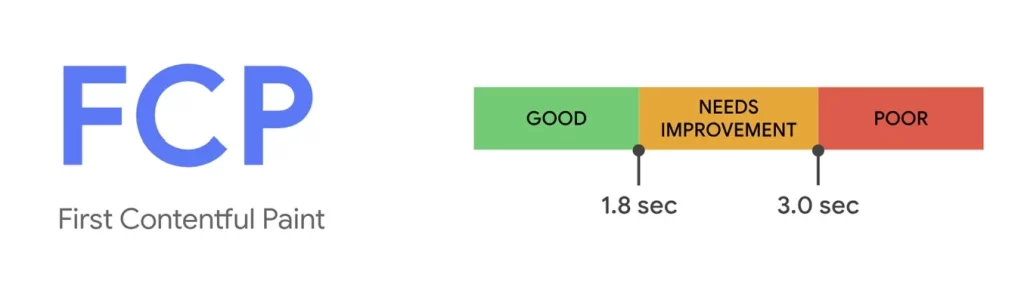
FCP is a performance metric that measures the time it takes for the first piece of content to be rendered on a web page. It indicates when users see any visual indication that the page is loading and content is being displayed.
FCP specifically tracks the rendering of the “primary content” of a page, which typically includes text, images, or other meaningful visual elements. It excludes background tasks, such as loading scripts or stylesheets, that may not contribute to the immediate visual experience.
FCP is important because it provides a user-centric perspective on page load speed. It helps evaluate the perceived performance and initial impression of a website by indicating how quickly users see something meaningful on their screens.
A lower FCP time indicates a faster rendering process and a better user experience, as it reduces the perceived load time and helps engage users more quickly. It is generally recommended to aim for an FCP time of under 1-2 seconds for optimal user satisfaction.
By monitoring and optimizing FCP, developers can identify and address performance bottlenecks that delay the initial content rendering, such as large resource sizes, slow server responses, or inefficient code execution. Optimising FCP can significantly improve the perceived performance and user satisfaction of a website, leading to better engagement and potentially higher conversion rates.
Improving the FCP time involves optimising various aspects of a website to ensure faster rendering of the initial content. Here are some strategies and best practices:
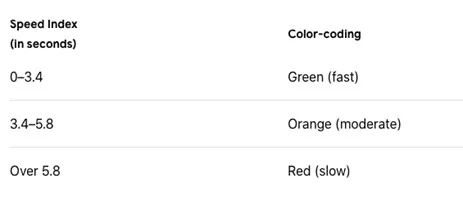
Speed Index (SI)
SI is a performance metric that quantifies how quickly the visual contents of a web page are rendered. It measures the perceived load time of a page by considering the progression of content rendering over time.
Unlike metrics like First Contentful Paint, which focus on the rendering of the first piece of content, the Speed Index looks at the entire rendering process. It calculates the average time at which visible parts of the page become progressively viewable during the loading process.
The lower the Speed Index value, the faster the perceived page load time. A smaller Speed Index indicates that the visual contents of the page are rendered more quickly, and users can view and interact with the page sooner.
Speed Index is particularly valuable because it captures the loading experience as a whole, taking into account the order in which content appears and the time it takes to render. It provides a more comprehensive understanding of the user's perception of page load speed compared to individual metrics like FCP or Time to Interactive.
To improve the Speed Index, similar optimisation strategies can be applied as for other performance metrics. These include optimising server response times, reducing render-blocking resources, compressing and optimising images, prioritising visible content, and optimising code and assets. By improving these aspects, you can reduce the time it takes for a page to visually load, resulting in a lower Speed Index and an improved user experience.
What’s a good Speed Index score?
A good Speed Index score should be under 3,4 seconds.
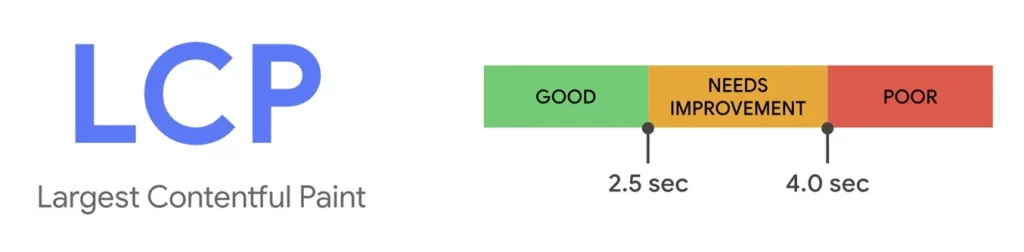
Largest Contentful Paint (LCP)
LCP is a performance metric that measures the time it takes for the largest visible content element to render within the viewport of a web page. It evaluates the loading speed of the most significant piece of content that users see when they initially access a webpage.
The content element considered for LCP is typically an image, a video, or a block-level text element. It represents the main content that users are likely interested in and can significantly impact their perception of page load speed.
LCP is crucial because it reflects how quickly the primary content becomes visible, allowing users to start engaging with the page. A faster LCP contributes to a better user experience, as it reduces the perceived loading time and helps users interact with meaningful content sooner.
To achieve a good LCP score, it is essential to optimise various factors that influence the rendering of the largest content element. Some effective strategies include:
By improving these aspects and continuously monitoring performance using tools like Lighthouse or PageSpeed Insights, you can improve the Largest Contentful Paint and enhance the perceived loading speed and user experience of your website.
To provide a good user experience, websites should strive to have an LCP of 2.5 seconds or less for at least 75% of page visits.
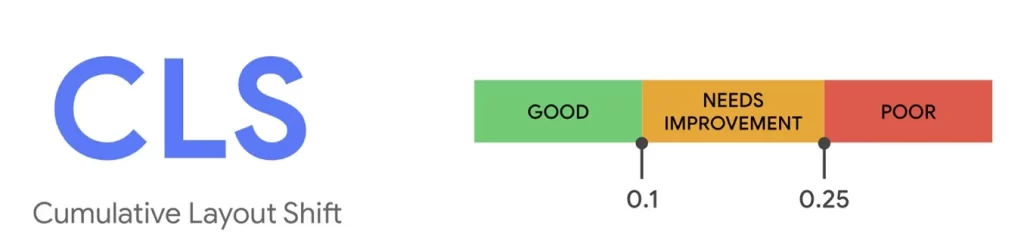
Cumulative Layout Shift (CLS)
CLS is a performance metric that measures the visual stability of a web page during its loading process. It quantifies the amount of unexpected layout shifts that occur as content loads and renders on the page.
Layout shifts happen when elements on a page change their position or size unexpectedly, causing the content to shift and potentially disrupt the user's experience. CLS is concerned with the cumulative effect of all these layout shifts that occur within the viewport.
CLS is particularly relevant for assessing the visual stability of a web page, especially in situations where content loads asynchronously or when resources like images or ads are being dynamically inserted. It helps gauge the extent to which a page's layout remains consistent and avoids annoying or confusing visual disruptions.
CLS is calculated by multiplying the impact fraction (the fraction of the viewport affected by the shift) by the distance fraction (the distance the element moves relative to the viewport size). The CLS score ranges from 0 to 1, with lower values indicating better visual stability.
To reduce Cumulative Layout Shift and improve the user experience, consider the following strategies:
By looking for a low Cumulative Layout Shift, you can provide a more visually stable experience for your users, ensuring that the page content remains consistent and preventing disruptive layout shifts that may lead to frustration or usability issues.
What is a good CLS score?
To provide a good user experience, websites should strive to have a CLS score of 0.1 or less. To ensure you're hitting this target for most of your users, a good threshold to measure is the 75th percentile of page loads, segmented across mobile and desktop devices.
Total Blocking Time (TBT)
Lighthouse's TBT is a performance metric that measures the total duration, in milliseconds, of all the blocking tasks that occur during the initial page load. It quantifies the amount of time the main thread of the browser is occupied with tasks that block user interaction and prevent the page from being responsive.
The main thread in a web browser handles various tasks, including executing JavaScript, performing style calculations, layout, and painting. When these tasks take a significant amount of time to complete, it can result in delays in user interactivity, making the page feel unresponsive or sluggish.
Total Blocking Time specifically focuses on the period when the page is loading and processing JavaScript code. It captures the time when the browser is busy executing tasks that may delay user interactions, such as event handling or responding to user input.
A lower TBT score indicates that the main thread is available for user interactions for a larger portion of the loading process. On the other hand, a higher TBT suggests that the main thread is occupied with blocking tasks, which can cause delays in user interactivity.
Optimising Total Blocking Time is important to enhance the interactivity and responsiveness of a web page. Some strategies to improve TBT include:
What is a good TBT score?
To provide a good user experience, websites should strive to have a TBT of less than 200 milliseconds, when tested on average mobile hardware.
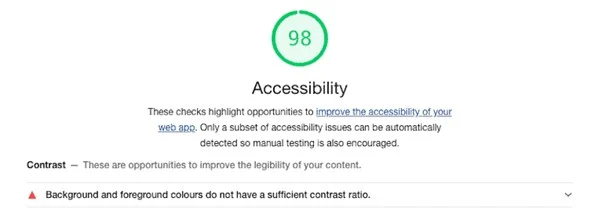
Lighthouse assesses accessibility by examining factors such as proper HTML structure, alternative text for images, keyboard navigation support, and adherence to accessibility standards (e.g., Web Content Accessibility Guidelines - WCAG). It provides insights into the website's accessibility status and suggests improvements to ensure inclusivity.
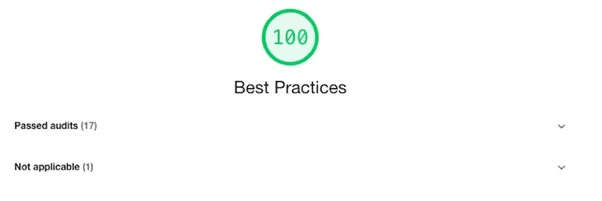
Lighthouse evaluates the website's adherence to best practices, including the use of secure connections (HTTPS), efficient caching strategies, optimised images and code, and other industry-recommended practices. It highlights areas where improvements can be made to enhance the website's performance, security, and efficiency.
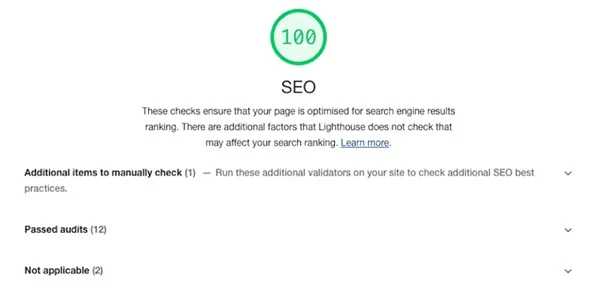
Lighthouse examines SEO-related factors, such as meta tags, headings, mobile-friendliness, and crawlability. It provides recommendations to improve the website's visibility in search engine results, ultimately driving organic traffic and improving search engine rankings.
Optimising the performance of a website is crucial for delivering a fast, responsive, and enjoyable user experience. Tools like Lighthouse provide valuable insights into various performance metrics, allowing developers to identify areas of improvement and make data-driven optimisations.
Metrics such as First Contentful Paint (FCP), Largest Contentful Paint (LCP), Speed Index (SI), Total Blocking Time (TBT), and Cumulative Layout Shift (CLS) offer valuable measurements of different aspects of a website's performance.
By understanding these metrics and their significance, developers can implement various optimisation strategies. These include minimizing render-blocking resources, optimising images and code, prioritising critical content, improving server response times, and addressing issues causing layout shifts. Regular monitoring, testing, and iteration are crucial for maintaining and improving performance over time.
Resources:
Google Lighthouse is an open-source automated tool developed by Google that helps evaluate and improve website’s performance, accessibility, best practices, and Search Engine Optimization (SEO). It provides developers, designers, and website owners with valuable insights and recommendations to enhance the overall quality and user experience of a website.
Lighthouse performs audits on web pages by simulating the loading and rendering process in a controlled environment. It measures various performance metrics, including page load speed, network efficiency, rendering performance, and interactivity. It also checks for accessibility issues, such as proper HTML structure, alt text for images, and keyboard navigation support. Additionally, Lighthouse examines the implementation of best practices, such as using secure connections (HTTPS), optimising images and code, and ensuring responsive design.
After conducting the audits, Lighthouse generates a comprehensive report with a performance score and detailed recommendations for improvement. The report highlights areas where the website excels and areas that require attention or optimisation. It provides specific suggestions, code snippets, and resources to address identified issues and enhance the website's overall performance and user experience.
Google Lighthouse is widely used by developers, designers, and website owners as a valuable tool for identifying and resolving performance bottlenecks, accessibility barriers, and SEO deficiencies. By following Lighthouse's recommendations, website owners can deliver faster, more accessible, and search engine-friendly websites that provide an exceptional user experience.
The Lighthouse report is a comprehensive assessment that provides detailed insights into the performance, accessibility, best practices, and SEO aspects of a website. The report consists of various metrics and recommendations to help improve the website's overall quality and user experience.
Here are some key metrics commonly included in a Lighthouse report.
Lighthouse measures performance-related metrics, which evaluate the loading speed and responsiveness of the website, helping identify areas for optimisation.
First Contentful Paint (FCP)
FCP is a performance metric that measures the time it takes for the first piece of content to be rendered on a web page. It indicates when users see any visual indication that the page is loading and content is being displayed.
FCP specifically tracks the rendering of the “primary content” of a page, which typically includes text, images, or other meaningful visual elements. It excludes background tasks, such as loading scripts or stylesheets, that may not contribute to the immediate visual experience.
FCP is important because it provides a user-centric perspective on page load speed. It helps evaluate the perceived performance and initial impression of a website by indicating how quickly users see something meaningful on their screens.
A lower FCP time indicates a faster rendering process and a better user experience, as it reduces the perceived load time and helps engage users more quickly. It is generally recommended to aim for an FCP time of under 1-2 seconds for optimal user satisfaction.
By monitoring and optimizing FCP, developers can identify and address performance bottlenecks that delay the initial content rendering, such as large resource sizes, slow server responses, or inefficient code execution. Optimising FCP can significantly improve the perceived performance and user satisfaction of a website, leading to better engagement and potentially higher conversion rates.
Improving the FCP time involves optimising various aspects of a website to ensure faster rendering of the initial content. Here are some strategies and best practices:
Speed Index (SI)
SI is a performance metric that quantifies how quickly the visual contents of a web page are rendered. It measures the perceived load time of a page by considering the progression of content rendering over time.
Unlike metrics like First Contentful Paint, which focus on the rendering of the first piece of content, the Speed Index looks at the entire rendering process. It calculates the average time at which visible parts of the page become progressively viewable during the loading process.
The lower the Speed Index value, the faster the perceived page load time. A smaller Speed Index indicates that the visual contents of the page are rendered more quickly, and users can view and interact with the page sooner.
Speed Index is particularly valuable because it captures the loading experience as a whole, taking into account the order in which content appears and the time it takes to render. It provides a more comprehensive understanding of the user's perception of page load speed compared to individual metrics like FCP or Time to Interactive.
To improve the Speed Index, similar optimisation strategies can be applied as for other performance metrics. These include optimising server response times, reducing render-blocking resources, compressing and optimising images, prioritising visible content, and optimising code and assets. By improving these aspects, you can reduce the time it takes for a page to visually load, resulting in a lower Speed Index and an improved user experience.
What’s a good Speed Index score?
A good Speed Index score should be under 3,4 seconds.
Largest Contentful Paint (LCP)
LCP is a performance metric that measures the time it takes for the largest visible content element to render within the viewport of a web page. It evaluates the loading speed of the most significant piece of content that users see when they initially access a webpage.
The content element considered for LCP is typically an image, a video, or a block-level text element. It represents the main content that users are likely interested in and can significantly impact their perception of page load speed.
LCP is crucial because it reflects how quickly the primary content becomes visible, allowing users to start engaging with the page. A faster LCP contributes to a better user experience, as it reduces the perceived loading time and helps users interact with meaningful content sooner.
To achieve a good LCP score, it is essential to optimise various factors that influence the rendering of the largest content element. Some effective strategies include:
By improving these aspects and continuously monitoring performance using tools like Lighthouse or PageSpeed Insights, you can improve the Largest Contentful Paint and enhance the perceived loading speed and user experience of your website.
To provide a good user experience, websites should strive to have an LCP of 2.5 seconds or less for at least 75% of page visits.
Cumulative Layout Shift (CLS)
CLS is a performance metric that measures the visual stability of a web page during its loading process. It quantifies the amount of unexpected layout shifts that occur as content loads and renders on the page.
Layout shifts happen when elements on a page change their position or size unexpectedly, causing the content to shift and potentially disrupt the user's experience. CLS is concerned with the cumulative effect of all these layout shifts that occur within the viewport.
CLS is particularly relevant for assessing the visual stability of a web page, especially in situations where content loads asynchronously or when resources like images or ads are being dynamically inserted. It helps gauge the extent to which a page's layout remains consistent and avoids annoying or confusing visual disruptions.
CLS is calculated by multiplying the impact fraction (the fraction of the viewport affected by the shift) by the distance fraction (the distance the element moves relative to the viewport size). The CLS score ranges from 0 to 1, with lower values indicating better visual stability.
To reduce Cumulative Layout Shift and improve the user experience, consider the following strategies:
By looking for a low Cumulative Layout Shift, you can provide a more visually stable experience for your users, ensuring that the page content remains consistent and preventing disruptive layout shifts that may lead to frustration or usability issues.
What is a good CLS score?
To provide a good user experience, websites should strive to have a CLS score of 0.1 or less. To ensure you're hitting this target for most of your users, a good threshold to measure is the 75th percentile of page loads, segmented across mobile and desktop devices.
Total Blocking Time (TBT)
Lighthouse's TBT is a performance metric that measures the total duration, in milliseconds, of all the blocking tasks that occur during the initial page load. It quantifies the amount of time the main thread of the browser is occupied with tasks that block user interaction and prevent the page from being responsive.
The main thread in a web browser handles various tasks, including executing JavaScript, performing style calculations, layout, and painting. When these tasks take a significant amount of time to complete, it can result in delays in user interactivity, making the page feel unresponsive or sluggish.
Total Blocking Time specifically focuses on the period when the page is loading and processing JavaScript code. It captures the time when the browser is busy executing tasks that may delay user interactions, such as event handling or responding to user input.
A lower TBT score indicates that the main thread is available for user interactions for a larger portion of the loading process. On the other hand, a higher TBT suggests that the main thread is occupied with blocking tasks, which can cause delays in user interactivity.
Optimising Total Blocking Time is important to enhance the interactivity and responsiveness of a web page. Some strategies to improve TBT include:
What is a good TBT score?
To provide a good user experience, websites should strive to have a TBT of less than 200 milliseconds, when tested on average mobile hardware.
Lighthouse assesses accessibility by examining factors such as proper HTML structure, alternative text for images, keyboard navigation support, and adherence to accessibility standards (e.g., Web Content Accessibility Guidelines - WCAG). It provides insights into the website's accessibility status and suggests improvements to ensure inclusivity.
Lighthouse evaluates the website's adherence to best practices, including the use of secure connections (HTTPS), efficient caching strategies, optimised images and code, and other industry-recommended practices. It highlights areas where improvements can be made to enhance the website's performance, security, and efficiency.
Lighthouse examines SEO-related factors, such as meta tags, headings, mobile-friendliness, and crawlability. It provides recommendations to improve the website's visibility in search engine results, ultimately driving organic traffic and improving search engine rankings.
Optimising the performance of a website is crucial for delivering a fast, responsive, and enjoyable user experience. Tools like Lighthouse provide valuable insights into various performance metrics, allowing developers to identify areas of improvement and make data-driven optimisations.
Metrics such as First Contentful Paint (FCP), Largest Contentful Paint (LCP), Speed Index (SI), Total Blocking Time (TBT), and Cumulative Layout Shift (CLS) offer valuable measurements of different aspects of a website's performance.
By understanding these metrics and their significance, developers can implement various optimisation strategies. These include minimizing render-blocking resources, optimising images and code, prioritising critical content, improving server response times, and addressing issues causing layout shifts. Regular monitoring, testing, and iteration are crucial for maintaining and improving performance over time.
Resources: